A Gantt chart is a visual project management tool that’s used to track tasks, dependencies, and milestones throughout an engagement. In this guide, we explore the key components of a Gantt chart, how to create and use one, and how to use a Gantt chart scheduler in resource management.
Key takeaways
-
A Gantt chart is a project management tool that provides a visual representation of a project’s timeline, and the tasks required to deliver it on time and on budget
-
The key components of a Gantt chart include a task list, timeline, dependencies, milestones, and progress indicators
-
Gantt charts are used by professional services firms to visualize timelines, map out task sequences and dependencies, allocate resources to individual tasks, identify bottlenecks, and track progress
-
The benefits of using a Gantt chart include enhanced, firm-wide visibility, the ability to foster a culture of accountability, more optimized resource utilization, and improved stakeholder communication
-
Dayshape’s Gantt scheduling software aligns project scheduling with resource management to create a single source of truth for monitoring engagement progress
Contents
1. What is a Gantt chart?
2. History of the Gantt chart
3. What is a Gantt chart used for in project management?
4. What are the key components of a Gantt chart?
5. Gantt chart advantages and disadvantages
6. Gantt chart vs PERT chart vs Kanban board
7. How to create a Gantt chart
8. Gantt chart best practice tips
9. Who uses a Gantt chart?
10. Can I make a Gantt chart in Google Sheets?
11. Can I make a Gantt chart in Excel?
12. Can Gantt charts be used for all types of projects?
13. What role does AI play in an agile Gantt chart?
14. What are the key features to look for in Gantt chart software?
15. Transform resource management with Dayshape’s agile Gantt chart scheduler
What is a Gantt chart?
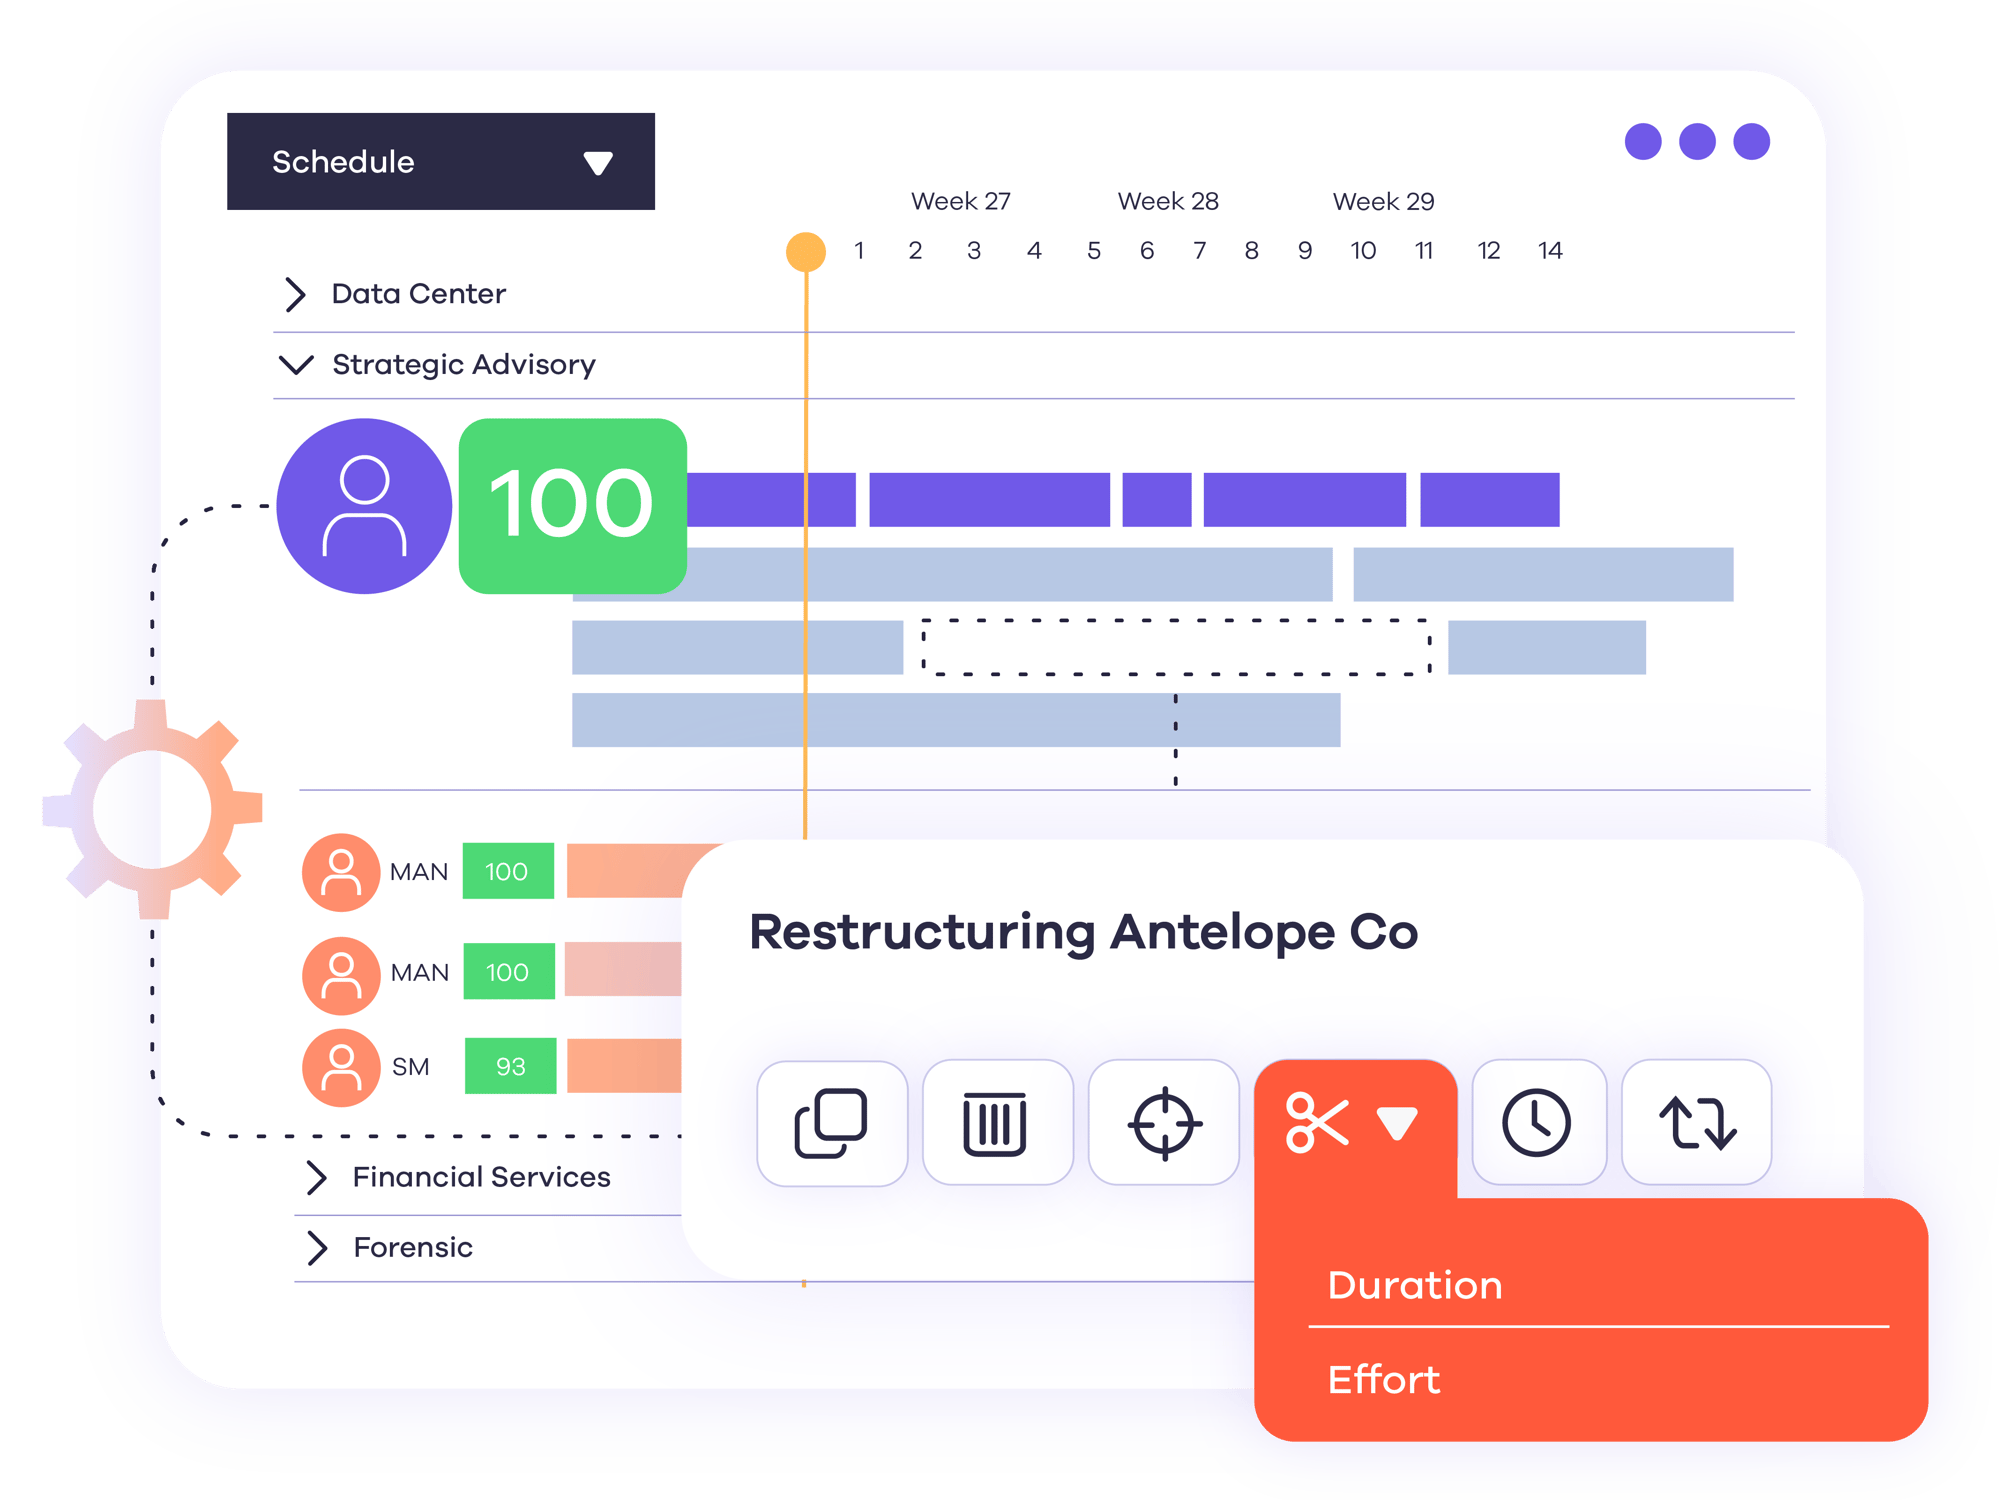
A Gantt chart is a project management tool that provides a visual representation of a project’s schedule over a defined timeline. A Gantt chart displays tasks as horizontal bars, mapping individual tasks, deliverables, and key milestones against calendar dates.
-
Horizontal axis displays days, weeks, or months
-
Vertical axis lists the tasks required to deliver a project within that timescale
The length of each horizontal bar in a Gantt chart indicates a task's duration, showing its planned start date, end date, and progress over time. This means that the chart provides a shared, centralized view of a project’s roadmap.
Gantt charts help professional services firms better understand how individual engagements fit into wider timelines. Resource allocation can then be optimized to ensure on-time, on-budget project completion.
History of the Gantt chart
The concept of the Gantt chart was first developed in the late 19th century by a Polish engineer named Karol Adamiecki, who devised a workflow diagram that he called a harmonogram. However, the chart we know today is actually named after American engineer Henry Gantt, who independently designed and popularized his own similar system in the early 20th century, which became known as the Gantt chart.
Henry Gantt used his charts to track worker productivity and manufacturing output, with the system gaining traction during the First World War to monitor logistics management, shipbuilding, and munitions production.
Initially, Gantt charts were paper-based or drawn on a board, which would need to be redrafted every time a project’s schedule shifted. With the advent of computers in the late 20th century, Gantt charts became a popular digital project management tool, and now regularly incorporate AI for greater agility.
What is a Gantt chart used for in project management?
Gantt charts have multiple uses in project management, including:
-
Visualizing timelines: a Gantt chart provides a visual representation of a project’s schedule, including individual task durations, which will be displayed as rectangular bars, often in different colors
-
Mapping dependencies: Gantt charts highlight critical dependencies, showing which tasks cannot begin until a previous one is completed. This helps to prevent sequencing errors and other project bottlenecks
-
Resource management: Gantt scheduling can also play a key role in resource management, allocating named people to individual tasks, allowing resource managers to identify instances of under- or overutilization
-
Tracking progress: the best Gantt charts will track key project milestones to monitor progress in real time
-
Identifying bottlenecks: when project leaders can clearly see how an engagement is progressing, they can identify and address potential project delays before they impact overall delivery and client satisfaction
-
Communicating with stakeholders: Gantt charts are an effective way to provide a clear, visual report to key stakeholders at different stages throughout the project’s duration
What are the key components of a Gantt chart?
Gantt charts comprise several key components. Each firm will add its own preferred level of detail to these, but here are the components every Gantt chart requires:
1. Task list
All of the tasks (including subtasks) required to deliver the project on time and on budget need to be detailed along the left, vertical axis of a Gantt chart.
2. Timeline
The project timeline will be represented by the horizontal axis of the chart, showing the overall timescale of the engagement. Make it clear what unit of time is being represented by the Gantt chart; some will work in days or weeks, while others will use months or quarters.
3. Task bars
Horizontal – often rectangular – bars will be plotted across the timeline to indicate each individual task’s start date, end date, and total duration. Task bars may be labeled to detail the resource assigned to the task, and color coding may be used to show who’s responsible for a particular item.
4. Key milestones
Milestones are another key component of a Gantt chart; many tools will use diamond-shaped icons to show milestones, representing points where decisions, handovers, or other actions are needed.
5. Dependencies
On a Gantt chart, dependencies are typically shown using lines or arrows that connect one task bar to another. This shows where one task needs to be completed before another begins, and can be useful to help project and resource managers identify potential bottlenecks and clashes.
6. Progress indicators
Gantt charts will generally use shading within a task part to show the percentage of a task that has been completed. Other common progress indicators may include vertical lines with a date stamp that act as a real-time indicator of engagement progress.
Gantt chart advantages and disadvantages
Gantt charts can deliver multiple benefits in project and resource management, but they aren’t the right fit for every team. Below, we explore both the advantages and disadvantages of Gantt charts, and how to overcome potential challenges:
Gantt chart benefits
The benefits of Gantt chart utilization include:
-
Enhanced visibility: the visual nature of Gantt charts makes it easy to view a project’s entire schedule, plus start and end dates for individual tasks. This provides enhanced clarity to stakeholders, and creates a centralized single source of truth, replacing fragmented spreadsheets and removing silos
-
Create a culture of accountability: when everyone with access to a Gantt chart can see who’s responsible for each dependency, this fosters a culture of accountability, increasing transparency and ownership
-
Improved resource utilization: Gantt charts also benefit resource management by clearly showing who’s working on which tasks when, preventing under- or overutilization or resource clashes, supporting resource optimization
-
Identify bottlenecks faster: proactively prevent bottlenecks with a clearer view of task dependencies, so you can address potential issues promptly and stop them escalating
-
Improved stakeholder communication: streamline reporting with a visual representation of project progress. Provide stakeholders with a single, shared view of the engagement timeline for full transparency
Gantt chart drawbacks
Be mindful of these potential drawbacks of using a Gantt chart to get the most out of the project management tool:
-
Complexity: Gantt charts can quickly become very complex, with too many interconnected tasks creating a hard-to-read diagram that requires constant updating. Avoid too much clutter, and make sure your chart can be easily understood by all stakeholders
-
Lack of flexibility: Gantt charts require a great deal of advance planning, but avoid making the schedule too rigid. A certain level of flexibility is required to accommodate project delays or scope changes, so build in buffers and keep the schedule agile
-
High maintenance requirements: a Gantt chart does require regular updates, but these should not be too time-consuming and cumbersome. Build in automation to your Gantt schedule to save time, reduce admin, and keep stakeholders updated in real time
-
False sense of precision: there is a risk that Gantt charts can create a false sense of precision, with fixed time blocks not necessarily aligning with real-world progress. What’s more, detailed Gantt bars can indicate that everything is under control, but dependencies may not have been taken into account
Gantt chart vs PERT chart vs Kanban board
Gantt charts aren’t the only tool used to manage a project schedule. Other common tools include PERT charts and Kanban boards. PERT stands for Program Evaluation and Review Template. Meanwhile, a Kanban board tracks project progress visually using a system of coloured cards placed in different columns, and gets its name from a Japanese word for ‘visual signal’.
| |
Gantt chart
|
PERT chart
|
Kanban board
|
|
Visual structure
|
A color-coded horizontal bar chart plotted across a calendar timeline
|
A diagram of connected nodes
|
Vertical columns representing different stages of project progress, with colored cards representing individual tasks
|
|
What it shows
|
Individual project tasks
Project timeline and schedule
Resource allocation
Key dependencies and milestones
|
Task sequence
Task dependencies
Estimated task duration
Critical path analysis
|
A continuous workflow
Individual task status
Work-in-progress limits
|
|
Benefits
|
Enhanced visibility
Fosters accountability
Improved resource management
Fast bottleneck identification
|
Clarifies dependencies
Critical path identification
Encourages improved collaboration
|
Easy to understand
Highly flexible
Fluid and continuous
Places greater focus on immediate workflow
|
|
Best for
|
Managing structured professional services engagements with a firm-wide view
|
Initial project planning, where engagements are complex and timelines are uncertain
|
Managing high-volume work, such as tax compliance
|
How to create a Gantt chart
Here’s how to create a Gantt chart step-by-step:
1. Outline project scope
The first step to creating a Gantt chart is to define the scope of the project you need to plot, and list all of the tasks that will be required to deliver it on time and in line with expectations. Then, break each of these tasks into smaller, more manageable subtasks, and plot these as task bars on your Gantt chart.
2. Establish dependencies
The next step is to map out task sequences and establish task dependencies. Identify which tasks need to be completed before another one begins, and make sure these links are clear to see on your Gantt timeline.
3. Estimate timelines
Once all of your tasks are mapped out, you need to assign start dates and target completion dates to every task. Factor in buffers, and be mindful that these are only estimates – it is unlikely that everything will run exactly on time, so be realistic about the dates you attach to tasks.
4. Allocate resources
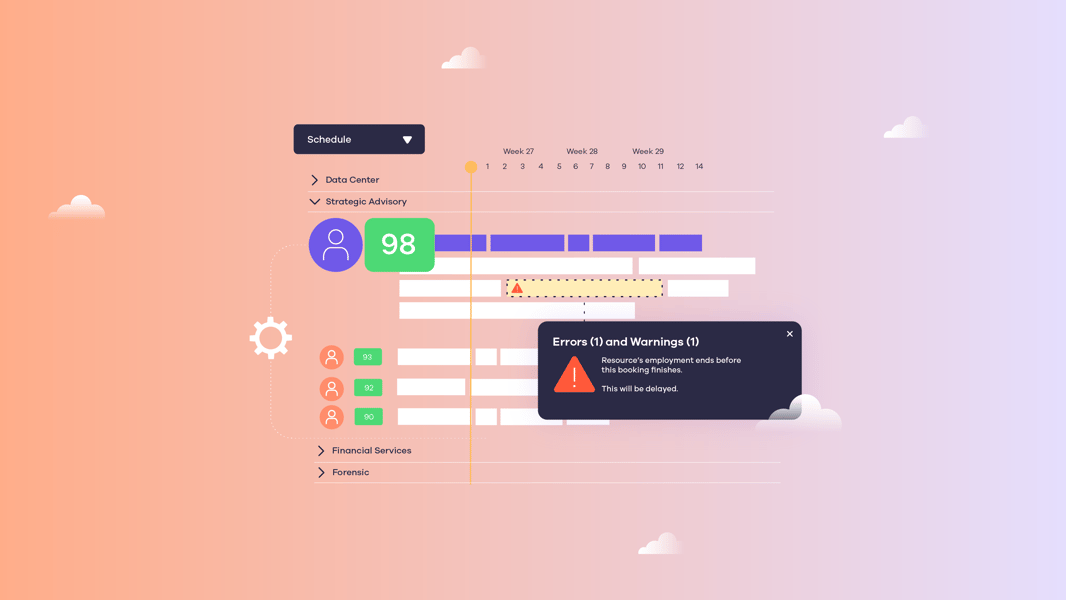
Creating an effective Gantt chart also requires strategic resource allocation. Use skills-based scheduling to assign the most qualified team members to individual tasks. Our AI-powered scheduler makes this easy, allocating people to tasks based on their skills, preference, and availability.
5. Identify milestones
Next, identify key milestones that will occur during the project timeline, and plot these on the chart. Milestones could include client sign-offs, completion of key phases, or points where check-ins or handovers are required.
6. Monitor and adjust
The final step in creating a Gantt chart is to continually monitor and adjust the timeline as the project gets underway. A Gantt chart is never truly completed; it’s a live document that will shift as progress begins and scope or availability changes.
Gantt chart best practice tips
Maximize the value of your Gantt chart by following these proven best practices:
-
Prioritize simplicity: keep your Gantt chart simple, clear, and easy to understand. Avoid overloading it with too many micro details that can quickly become cluttered and confusing. Group micro tasks into larger subtasks, and break down larger goals into smaller actionable steps
-
Assign clear ownership: make sure every task is assigned to a specific resource. This will help to promote a culture of accountability, and means any resource conflicts can be quickly identified
-
Build in buffers: most projects will encounter a delay or change in scope at one point or another. Add in buffer time to keep your Gantt chart agile and prevent delays from escalating
-
Align timelines with engagement economics: integrate capacity planning and project financials into your Gantt schedule for full alignment. Project and resource managers can then better understand the financial impact of unexpected delays or changes in scope
-
Stay agile: keep your project schedule agile with Dayshape Gantt chart software, which aligns scheduling with resource management, and uses automation to track project progress
Andrew Bone, VP Product & Cofounder of Dayshape, explains: "Dayshape helps visualize and surface the big picture, allowing firms to run more efficiently by breaking down fiefdoms and challenging behaviors like favoritism.
“It’s about ensuring decisions aren’t made in silos, but are aligned with the firm’s overall goals, leading to better performance across the board.”
Gantt chart FAQs
Who uses a Gantt chart?
Gantt charts are primarily used by project, resource or program managers, as well as key project stakeholders, including C-suite executives. Gantt charts are especially beneficial in sectors with complex, large-scale, cross-functional operations, such as professional services, accountancy, consulting, engineering, and IT.
Can I make a Gantt chart in Google Sheets?
Yes, you can create a basic Gantt chart in Google Sheets, but this will not be as dynamic or agile as using a dedicated Gantt scheduling program. Spreadsheets are often fragmented, and still require manual updates, which take time and risk human error. The Dayshape Gantt scheduler removes these silos, reduces admin, saves teams time, and enables firm-wide visibility, creating a single source of truth.
Can I make a Gantt chart in Excel?
Yes, you can make a Gantt chart using Microsoft Excel, but this presents the same risks as a schedule built in Google Sheets.
Can Gantt charts be used for all types of projects?
Gantt charts are a versatile tool, but they’re not the right choice for every project. The engagements that are best suited to Gantt charts include those with a clear deadline, multiple phases and dependencies, and cross-team involvement, or others that would benefit from a clear, chronological roadmap.
What role does AI play in an agile Gantt chart?
AI can completely transform a Gantt chart, and incorporating it is a must for firms that want to remain competitive. Our AI-driven Gantt scheduling software enables:
-
Full portfolio scheduling
-
Dynamic timeline adjustments
-
Automated resource allocation, based on individuals’ skills, preference, and availability
-
Identify best-fit resources for every project
-
Maximize billable utilization
-
Prevent staff burnout from overutilization
-
Avoid resource clashes and conflicts
-
Data-driven capacity forecasting
-
Joined-up planning across offices, business lines, and countries
-
Reduced admin, saving time, resource, and costs
-
Seamless integration with existing workflows
What are the key features to look for in Gantt chart software?
When choosing Gantt chart software for your firm, key features to look for include:
-
Firm-wide visibility across teams, departments, and geographies
-
Resource utilization scoring
-
Suitability scoring
-
AI-powered scheduling
-
Real-time progress tracking
-
Integration with project financials
-
Seamless integrations
Transform resource management with Dayshape’s agile Gantt chart scheduler
Transform your firm’s approach to project and resource management with Dayshape’s dynamic Gantt chart scheduling software. See the big picture, reduce scheduling admin, avoid resource conflicts, and improve workforce planning confidence with our AI-driven Gantt scheduler.
Book a Dayshape demo today or contact our team to find out more.